Potential of SMOS to measure SSS with a precision better than 0.2
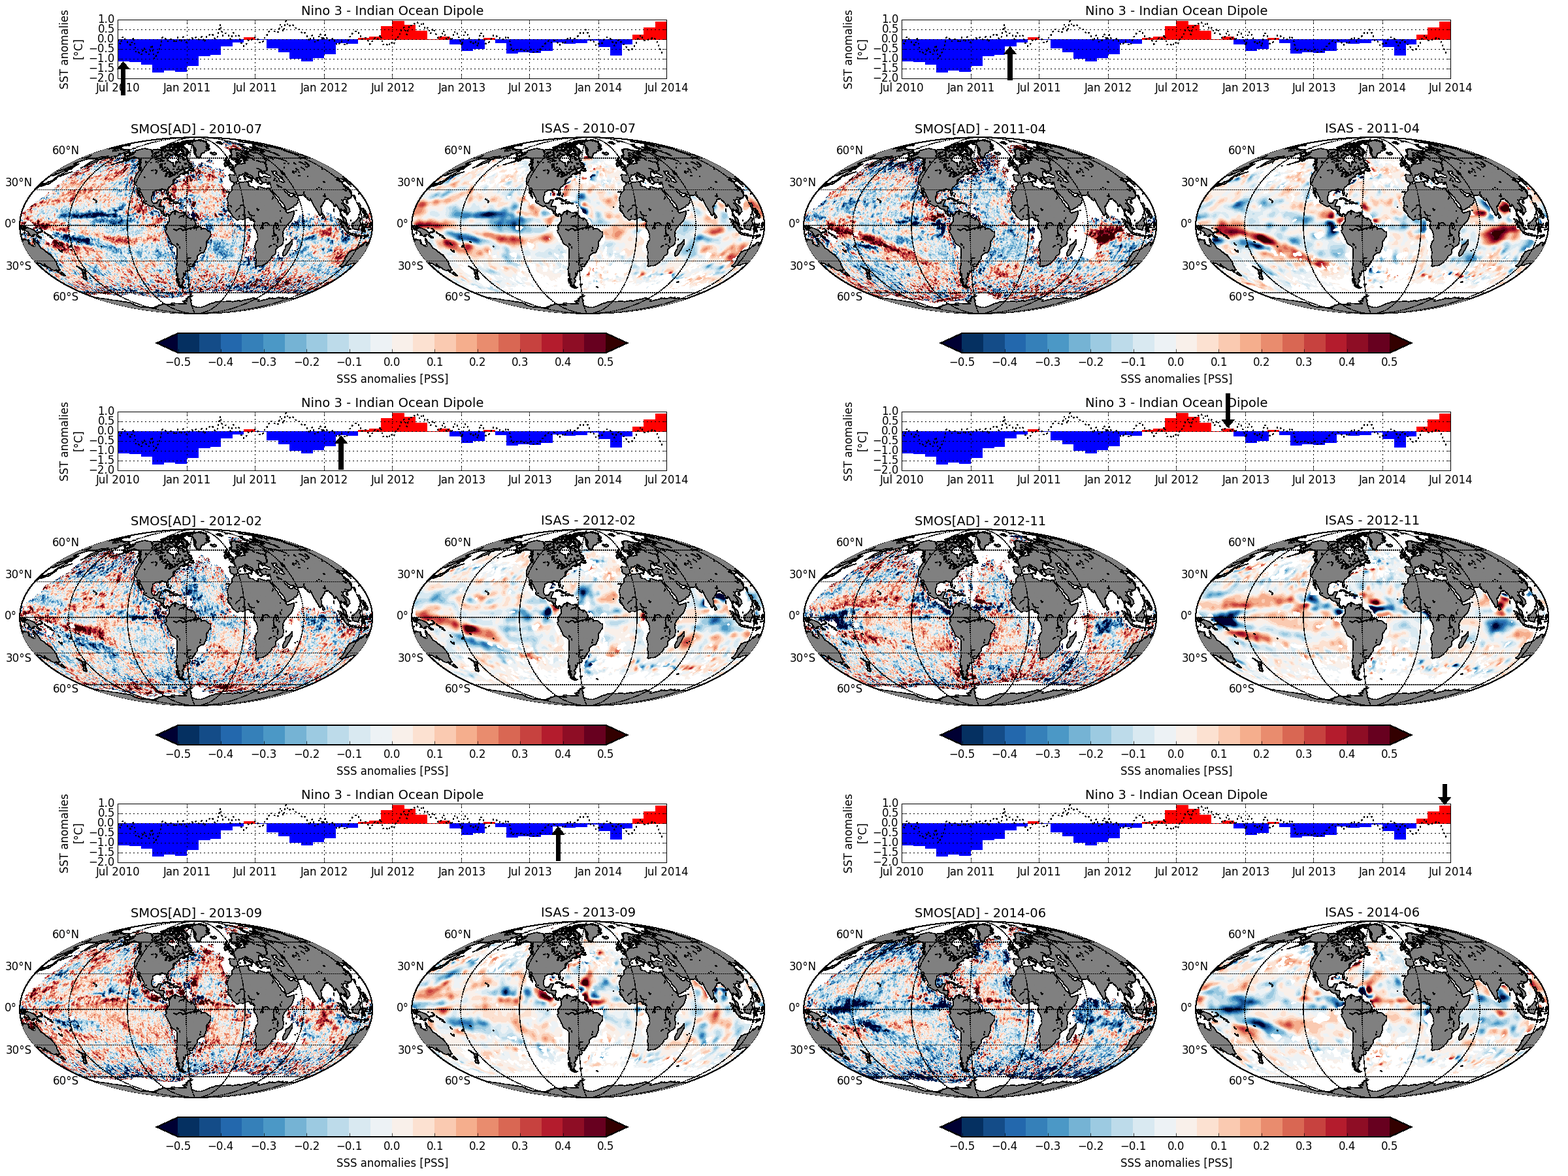
SMOS+SOS researchers at LOCEAN have extended the research on the large-scale interannual variability of sea surface salinity (SSS) from SMOS over the period 2010-2014 following on from Durand et al. (2013), Reul et al. (2013), and Hasson et al. (2014). There is a very good agreement between the monthly anomalies of SMOS SSS with respect to a SMOS SSS monthly climatology and the monthly SSS anomalies derived from in situ data using the In Situ Analysis System (ISAS) optimal interpolation by F. Gaillard (LPO) and the Coriolis Centre (Figure 1).

Figure 1: Top: SST anomaly in El Niño 3 box from http://www.cpc.ncep.noaa.gov/data/indices/sstoi.indices and corresponding Indian Ocean Dipole (IOD) Index (SST difference between eastern and western equatorial Indian Ocean) from the Australian bureau of Meteorology (BOM). Bottom: SMOS (left) and ISAS (right) SSS monthly anomalies with respect to a monthly climatology (July 2010-June 2014).
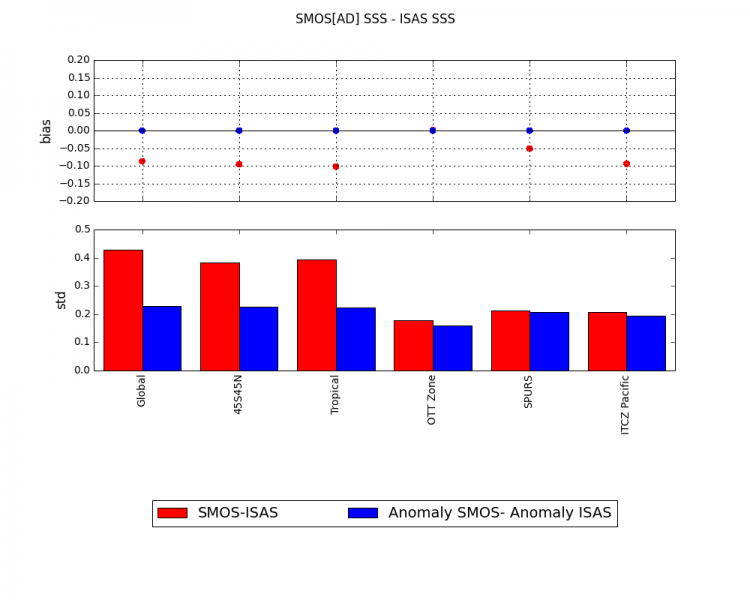
By computing anomalies with respect to 4-year monthly means, SMOS SSS systematic biases are removed (Figure 2). Over large regions, rms (root mean square) differences are of the order of 0.2 between SMOS SSS and ISAS SSS monthly anomalies, and 0.4 for SMOS SSS minus ISAS SSS. Part of this rms difference is due to spatial structures at shorter scales than 300 km not resolved by ISAS (Hernandez et al. 2014). This strongly suggests that SMOS has the potential of measuring SSS at monthly and 100 x 100 km2 scales with a precision better than 0.2 (Hernandez et al. 2014 found 0.15 in the Subtropical North Atlantic), provided that systematic biases are removed.
This study has been performed with CATDS CEC-LOCEAN maps built using ESA version 5 reprocessed SSS. Systematic latitudinal biases present in version 5 are expected to decrease in version 6.

Figure 2: Bias (top right) and standard deviation (bottom right) of the differences between SMOS and ISAS monthly SSS (red) and between SMOS and ISAS SSS anomalies (Blue). 6 regions are considered (from left to right): 60°S-60°N; 45°S-45°N; 30°S-30°N; (45°S-5°S, 140°W-95°W); (15°N-30°N, 45°W-30°W); (5°N-15°N, 110°W-180°W).
Durand, F., G. Alory, R. Dussin, and N. Reul (2013), SMOS reveals the signature of Indian Ocean Dipole events, Ocean Dynamics, 63(11-12), 1203-1212.
Hasson, A., T. Delcroix, J. Boutin, R. Dussin, and J. Ballabrera-Poy (2014), Analyzing the 2010–2011 La Niña signature in the tropical Pacific sea surface salinity using in situ data, SMOS observations, and a numerical simulation, Journal of Geophysical Research: Oceans, 119(6), 3855-3867, doi:10.1002/2013JC009388.
Hernandez, O., J. Boutin, N. Kolodziejczyk, G. Reverdin, N. Martin, F. Gaillard, N. Reul, and J. L. Vergely (2014), SMOS salinity in the subtropical north Atlantic salinity maximum: 1. Comparison with Aquarius and in situ salinity, Journal of Geophysical Research: Oceans, in press.
Reul, N., et al. (2013), Sea Surface Salinity Observations from Space with the SMOS Satellite: A New Means to Monitor the Marine Branch of the Water Cycle, Surv Geophys, 1-42.


